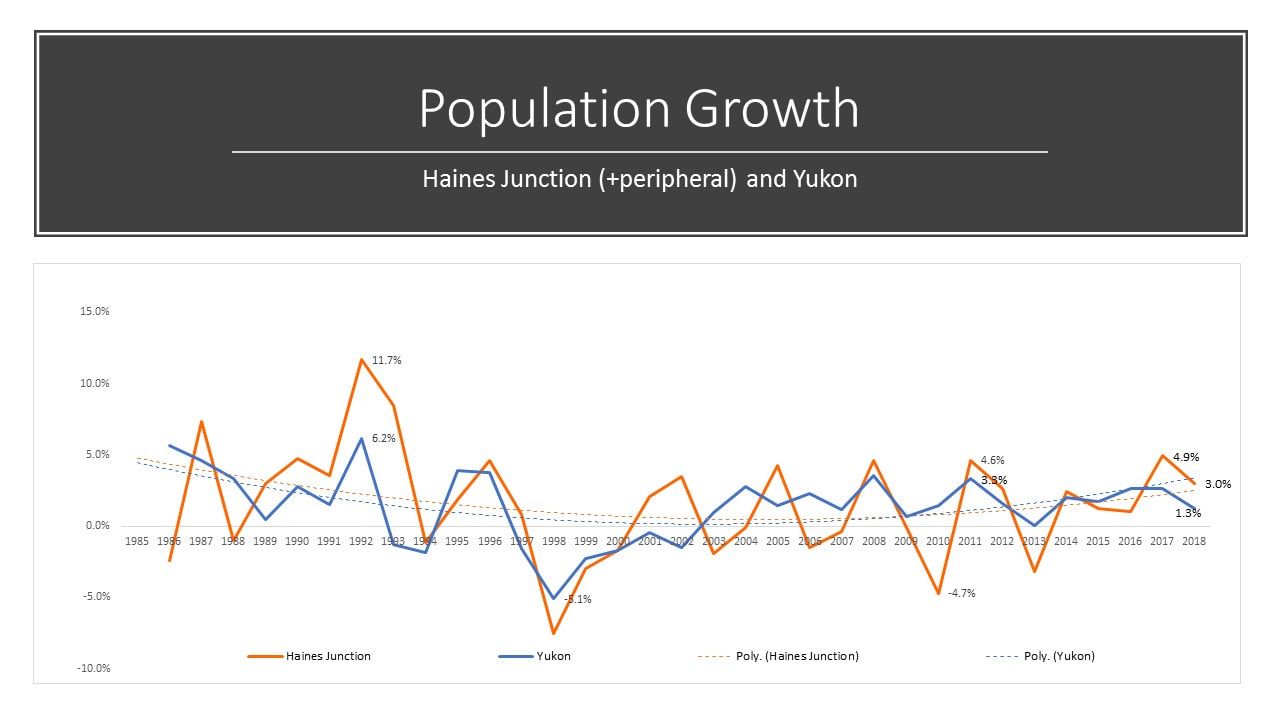
 A few weeks back, the Yukon Bureau of Statistics updated the SEWP portal data. It appears as though there was an adjustment in how the population estimates were calculated. As such, the previous population graphs that I've made don't accurately reflect the new data on SEWP. I'm not going to adjust the previous graphs because the data change isn't all that significant, but I have made new one to reflect the change in data (I use the December totals for each year, except for the year that we're currently in -- where I use the most recent data available). I've also changed the trendline to be polynomial, as I think it better reflects the growth rate, rather than a linear trendline that is biased from the early 90s population boom. On a positive note, Haines Junction's growth has seen a positive trend since 2014 and (not shown on this graph) is that the growth rate over the past 10 years is 11.7% (although the Yukon's is around 16%).
0 Comments
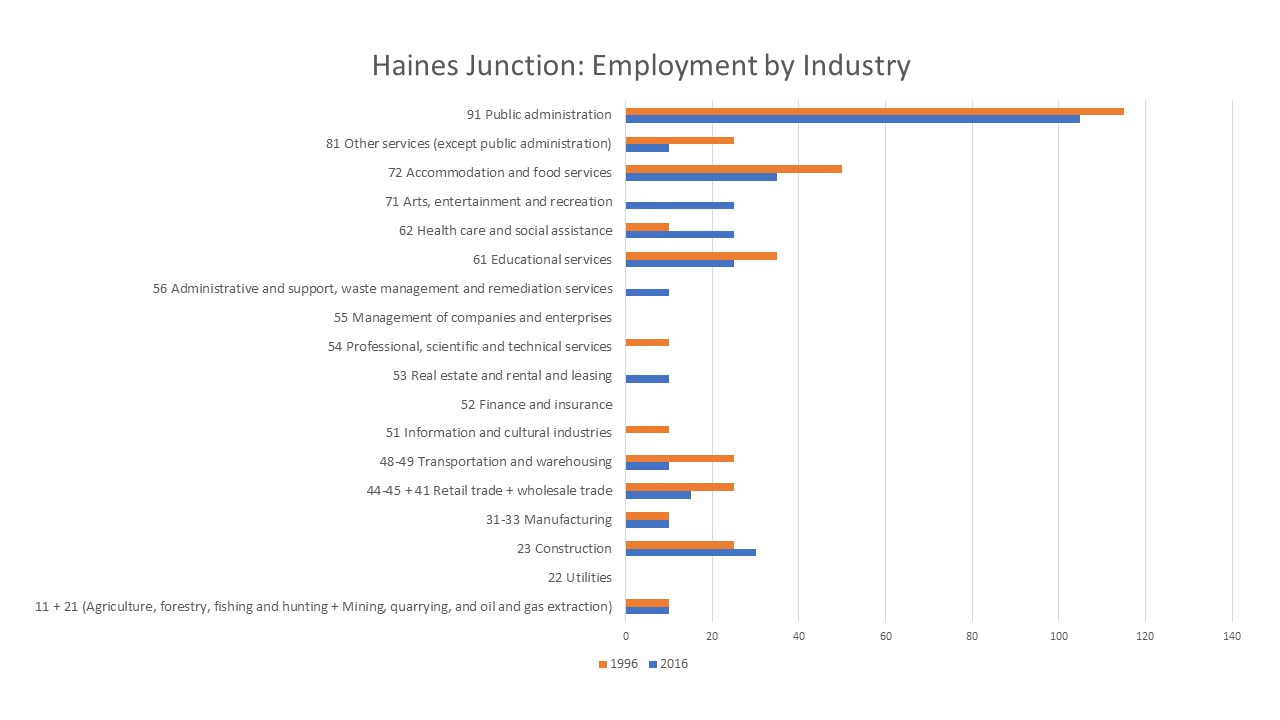 Thinking about the higher school enrolment we have this year at our school relative to the late 1990s when we had comparable levels of enrolment... what did our employment profile look like in Haines Junction? Census data is my only easily available source for this so I am comparing 2016 to 1996. We've changed how we categorize industry over that period of time so I had to use common sense to choose the best fit categories to take the 1996 data and make it relevant to 2016. For example, in 1996 the category was called "Primary Industry" so I've combined that into the NAICS 2012 categories 11 & 21.
Notable is the higher public admin, accommodation and food services, educational services and retail/wholesale in 1996. In 2016 there is higher construction and arts and entertainment. Keeping in mind, this is all very little data and comparisons are hard within such a small population size. 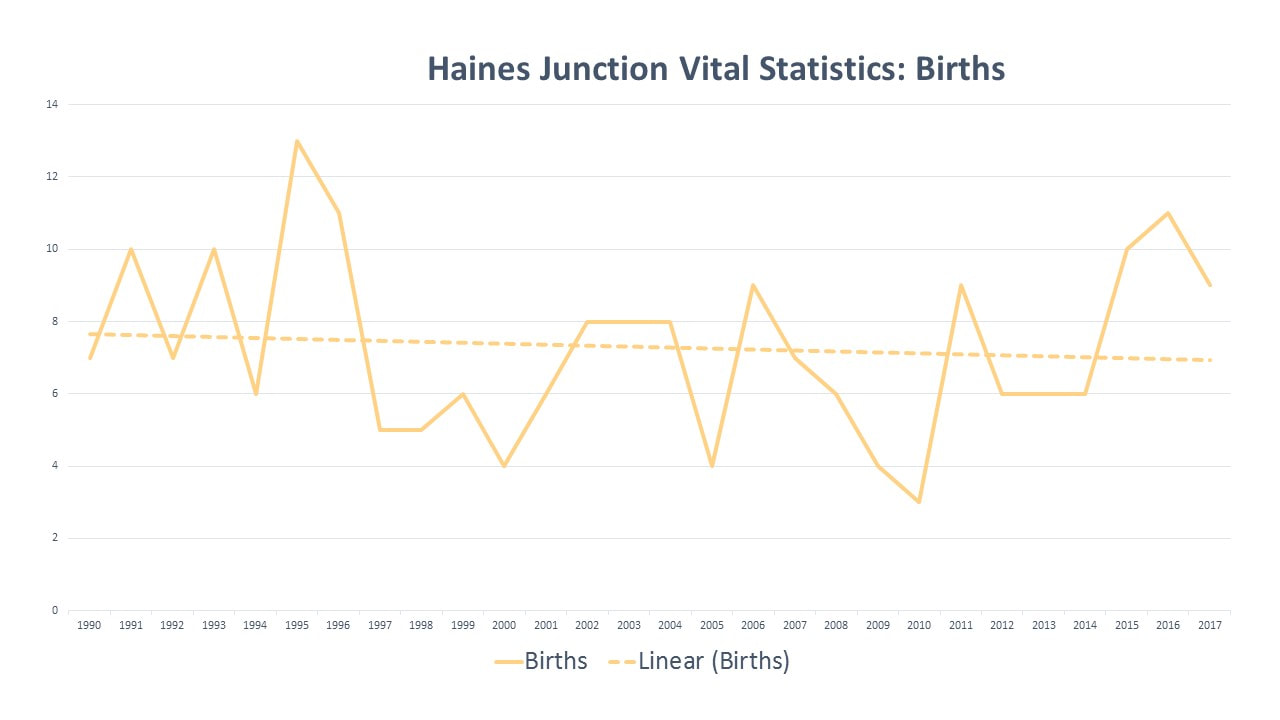 I woke up feeling very pregnant this morning -- so I made a graph about the number of births in our community. It seems like every couple of days, I get a call from a friend who has baby stuff to give me. Our storage area is now packed with baby stuff (much of which I have no idea what to do with). Anecdotally, it sure seems like we've had a bit of a baby boom here in the Junction over the past couple of years. The vital stats seem to indicate that... with a slightly higher number of births over the past couple of years. Notable, is the number of births back in the mid-90s... perhaps that's what led to the high school enrolment number that we saw in 1999. Featured on the same table from the socio-economic portal is the number of deaths -- so I plotted that too. 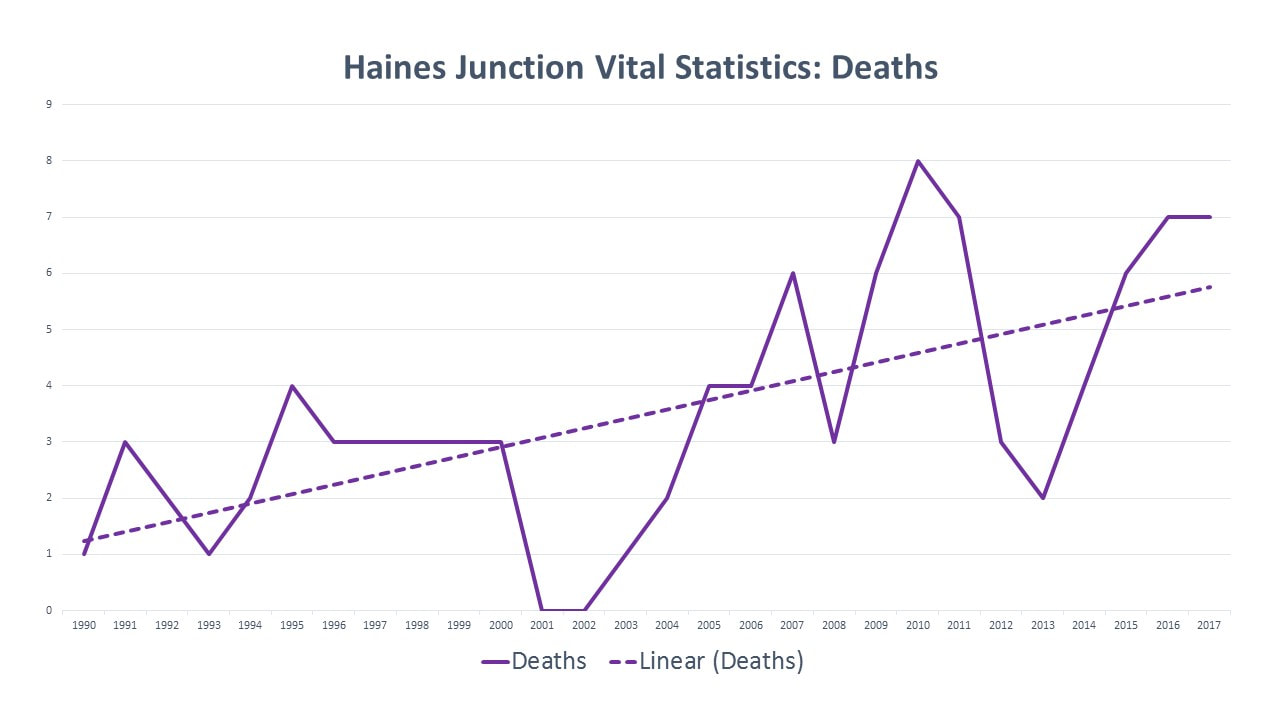 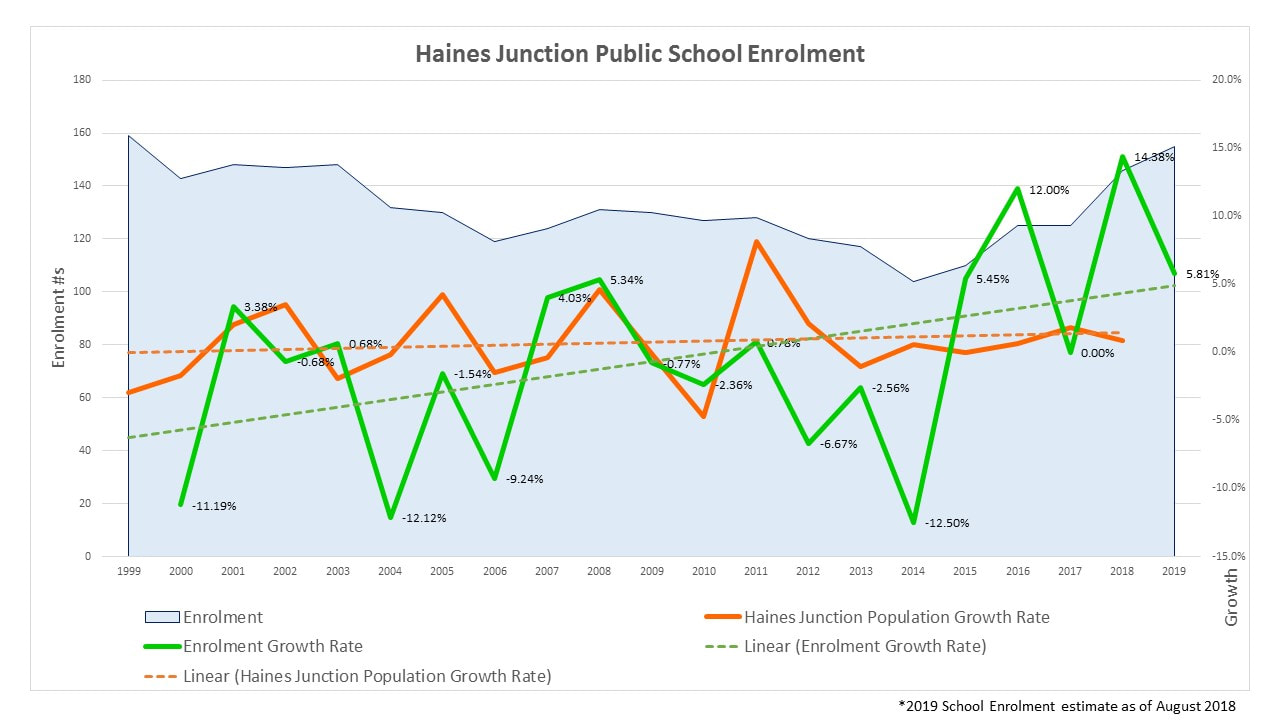 With the new school year well underway, there has been lots of talk in the territory about the shortage of supply teachers, safety at some schools and overcrowding. There isn't much data that I can pull about the St. Elias Community School, and the 2018 enrolment figure is an estimate, but I've graphed what I've got.
It's delightful to see a positive linear progression for enrolment growth. We're almost back to the enrolment high we saw back in 1999. However, we need to be mindful that that high enrolment rate in 1999 was from a population catchment area of approximate 774 and in 2018 we're at approximate 927 in our catchment. This, along with our high senior's dependency ratio, indicate that Haines Junction is aging. It's easy to imagine that our school community may feel pressure from the increased enrolment numbers. It looks as though student enrolment steadily declined for a number of years and then hovered at around 125-130 for quite a few years. The recent increase to 155 students, for such a small school, likely puts a strain on resources -- but overall it's a great indicator for the community of a rebounding youth population and let's hope we see growth trend continue over the coming years. Of note, Whitehorse and Yukon have very similar ratios (because the majority of the Yukon population lives in Whitehorse). HJ appears to historical had a proportionally higher seniors dependency ratio at 0.25 in 2017 compared with Whitehorse at 0.17 and Yukon at 0.18.
Youth = 0 to 19 Working Age = 20-64 Seniors = 65+ With regard to Dependency Ratio, Stats Can says: Importance of indicator A sizeable share of seniors aged 65 or older and children and youth younger than age 20 are likely to be socially and/or economically dependent on working-age Canadians, and they may put additional demands on health services. The demographic dependency ratio measures the size of the "dependent" population in relation to the "working age" population who theoretically provide social and economic support. 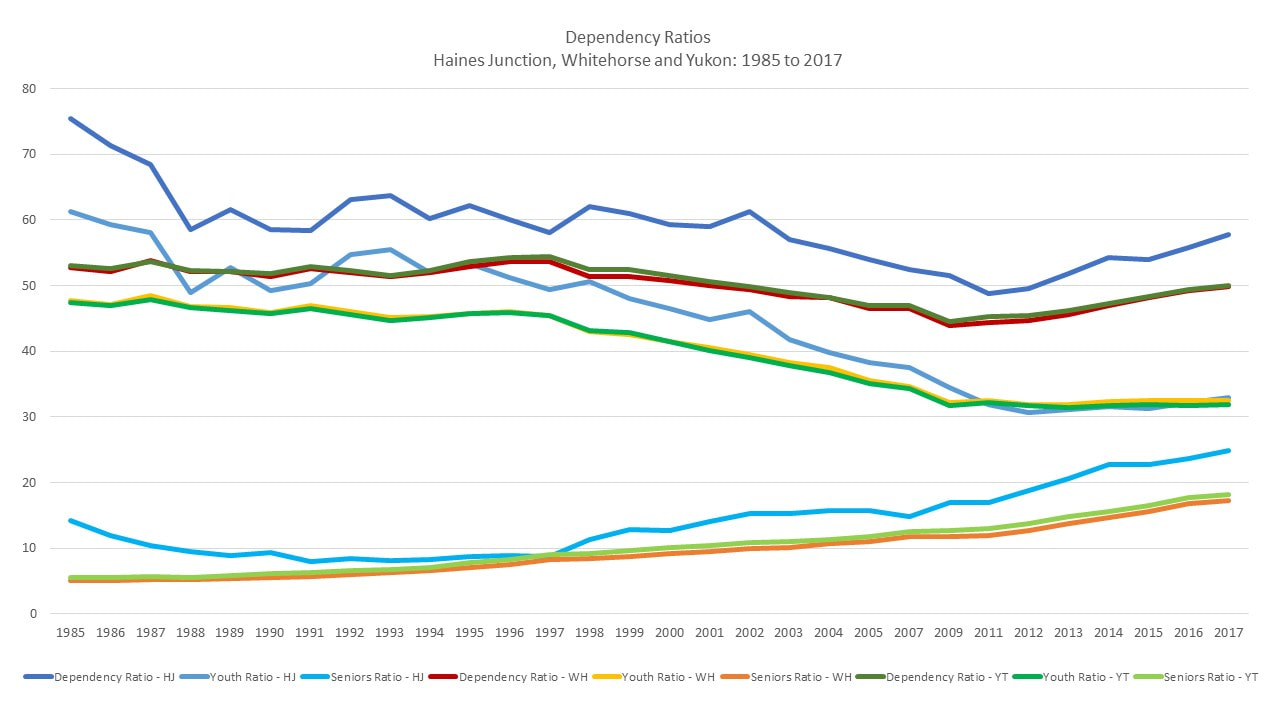 Mobility Status - 5 years ago Same as the last post but this time with migration patterns within 5 years of the survey date. updated (Jan 16-18) There was an error in my data set for the Whitehorse 2006 (5 year). 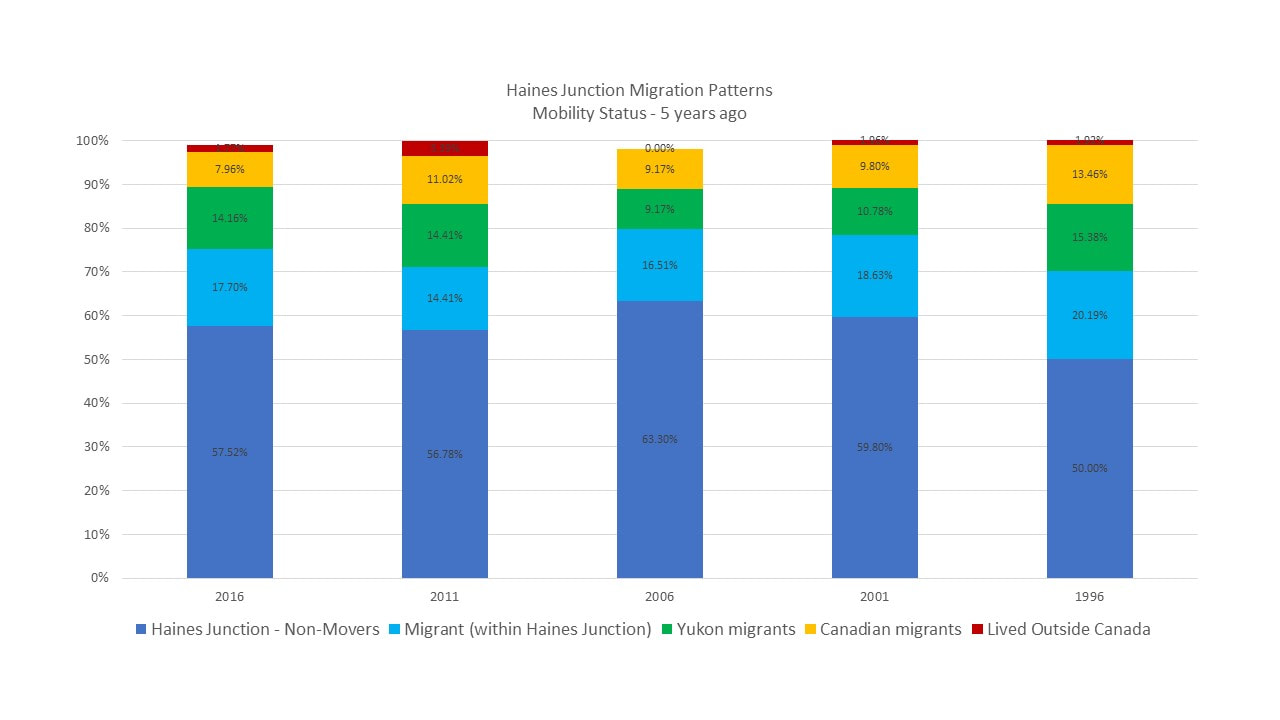 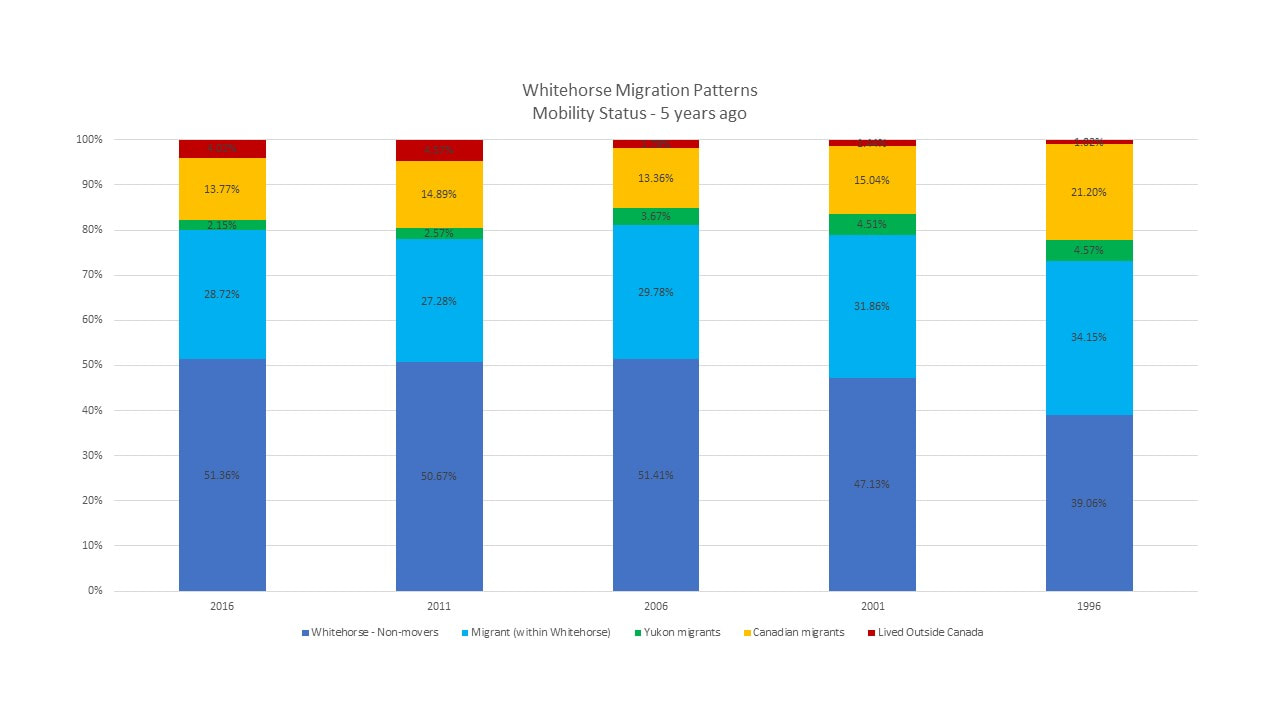 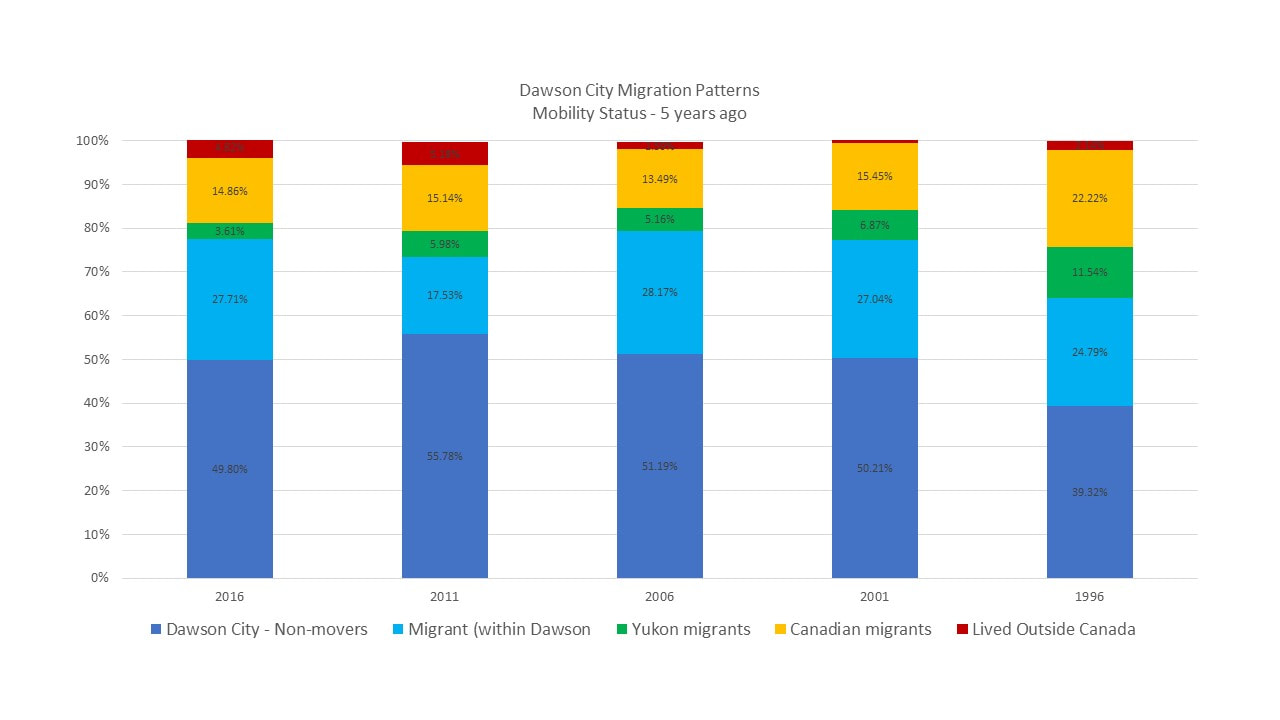 Interprovincial MigrationI made 300 buns at work yesterday... on days like that, where my task is routine and repetitive, I enjoy listening to audiobooks or podcasts. So while I rolled 300 buns I was listening to Tyler Cowen's The Complacent Class audio book (I'm also a semi-regular reader of Cowen's blog Marginal Revolution). If I recall correctly, Cowen argues that complacency is dominate in the current American narrative and is leading to increased inequality and decreasing productivity. I recognize that this is a grand sweeping statement but I was also focused predominantly on rolling buns and so I wasn't taking detailed notes on the audiobook... I'm just setting the background for why I made a graph about migration patterns this morning. But is seems as though Cowen is making an argument, very simply put, that migration is good for radical innovation/disruption... The Yukon numbers that I can easily access on this are pretty small. I could only find data back to 1996. In this initial look, I suppose the one thing to pull from this is that HJ has received a higher proportion of its migration from within the Yukon (green) than Whitehorse and Dawson. 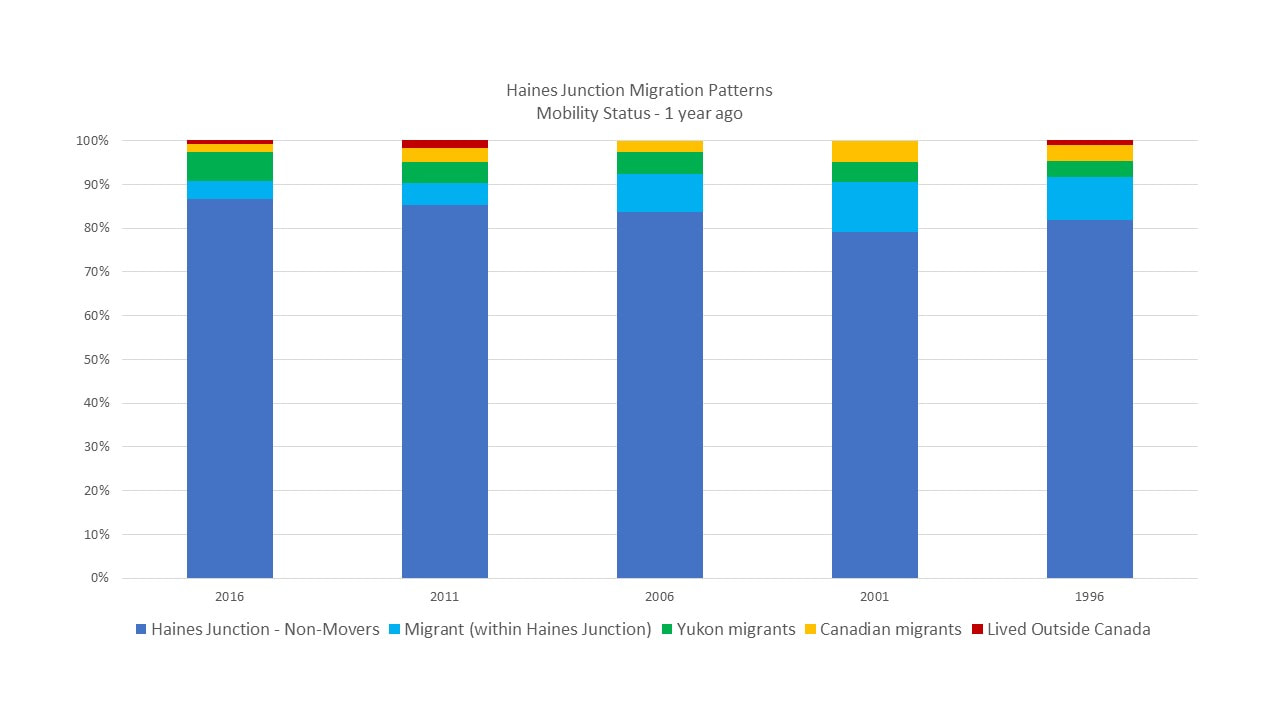 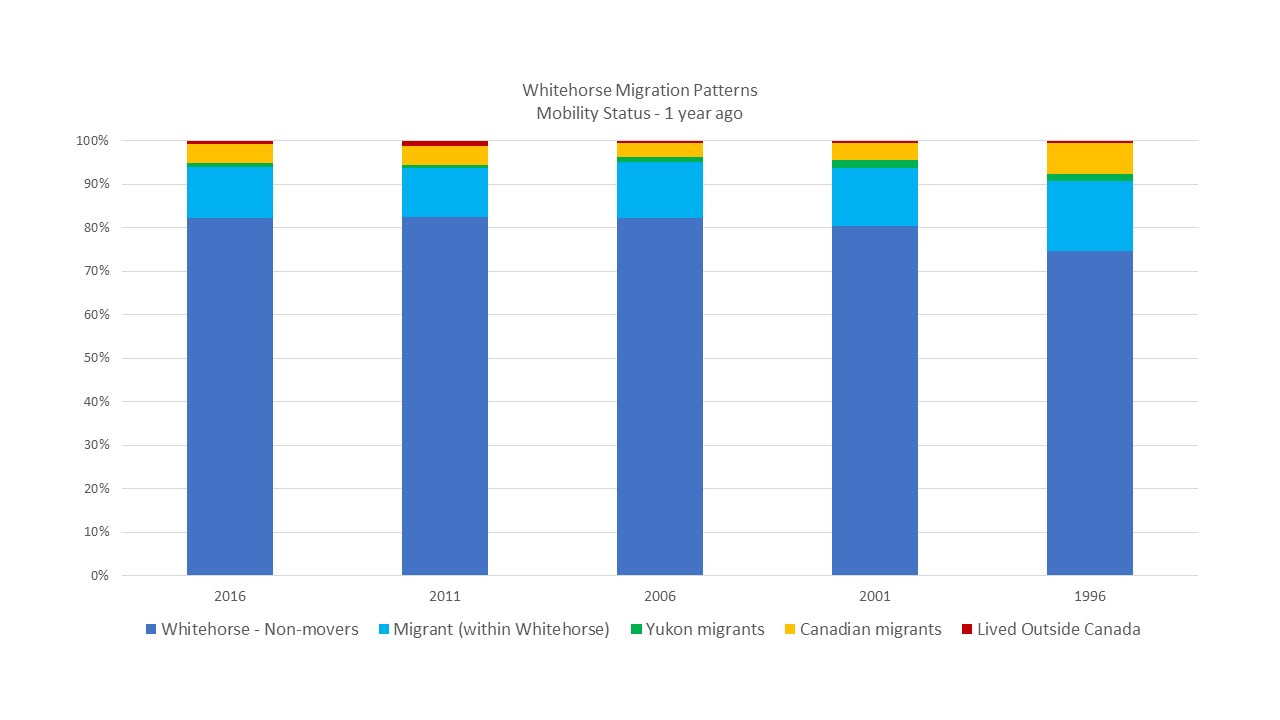 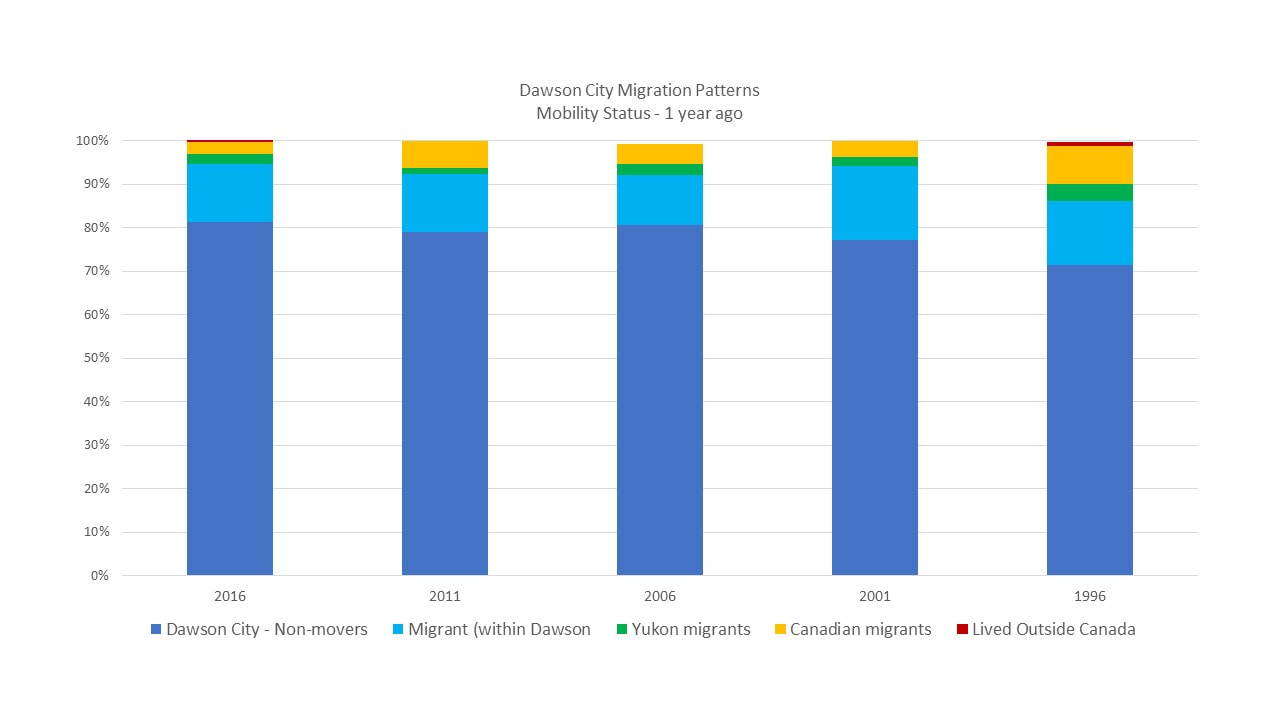 NOTES Updated on Jan 5: spectrum 25-44 divided into 25-34 and 35-44 for HJ, Yukon and Canada Updated on Jan 6: added Whitehorse Haines JunctionYukonCanadaWhitehorse |
AuthorThe majority of this data is sourced from the Yukon's Socio-Economic Portal Archives
December 2018
Categories
All
|
 RSS Feed